How Prometheus and Grafana Actually Work
When you start adding observability to your applications, the Prometheus ecosystem can be confusing. You install prometheus-client, but where are the dashboards? You hear about Prometheus and Grafana - are they the same thing? And why do you need three separate tools just to track some metrics?
This guide explains how the observability stack actually works - the three components, how they communicate, and most importantly, what’s stored in memory versus what’s persisted to disk. This last part is crucial for understanding how metrics flow through the system, yet most tutorials skip over it.
Understanding the Stack
Here’s the key insight: prometheus-client, Prometheus, and Grafana are three separate applications, not one tool.
When you run:
pip install prometheus-client
You get a Python library that helps your application expose metrics. But you still need:
- Prometheus (a separate application) to collect and store those metrics
- Grafana (another separate application) to visualize them
Here’s what each does:
- prometheus-client: Instrumentation library that lives in your application code
- Prometheus: Time-series database that scrapes and stores metrics
- Grafana: Visualization platform that queries Prometheus and renders dashboards
This guide walks through each component, shows how they interact with working examples, and explains the architecture decisions that make this separation useful.
The Three Separate Applications
Let’s break down each component and what it actually does:
1. prometheus-client (Instrumentation Library)
What it is: A language-specific library that lives in your application
This guide uses Python examples (pip install prometheus-client), but Prometheus has official client libraries for Go, Java, Ruby, and more. The concepts are identical across all languages.
What it does:
- Provides classes/functions to define metrics:
Counter,Histogram,Gauge - Formats metrics in Prometheus text format
- Exposes a
/metricsHTTP endpoint
What it does NOT do:
- Does NOT store metrics long-term
- Does NOT provide a UI
- Does NOT include Prometheus itself
Think of it as: A “printer driver” - helps your app output data in the right format
2. Prometheus (Standalone Go Application)
What it is: A completely separate application (not a Python library!)
How you get it: Docker image prom/prometheus:latest (or download the binary)
What it does:
- Scrapes your
/metricsendpoint every 15 seconds (configurable) - Stores time-series data in a database on disk
- Provides PromQL query language
- Includes a basic web UI at port 9090
Think of it as: The database that stores your metrics history
3. Grafana (Standalone Go/TypeScript Application)
What it is: Yet another separate application
How you get it: Docker image grafana/grafana:latest
What it does:
- Queries Prometheus using PromQL
- Renders beautiful dashboards
- Provides alerting (not covered here)
- Full web UI at port 3000
Think of it as: The visualization layer
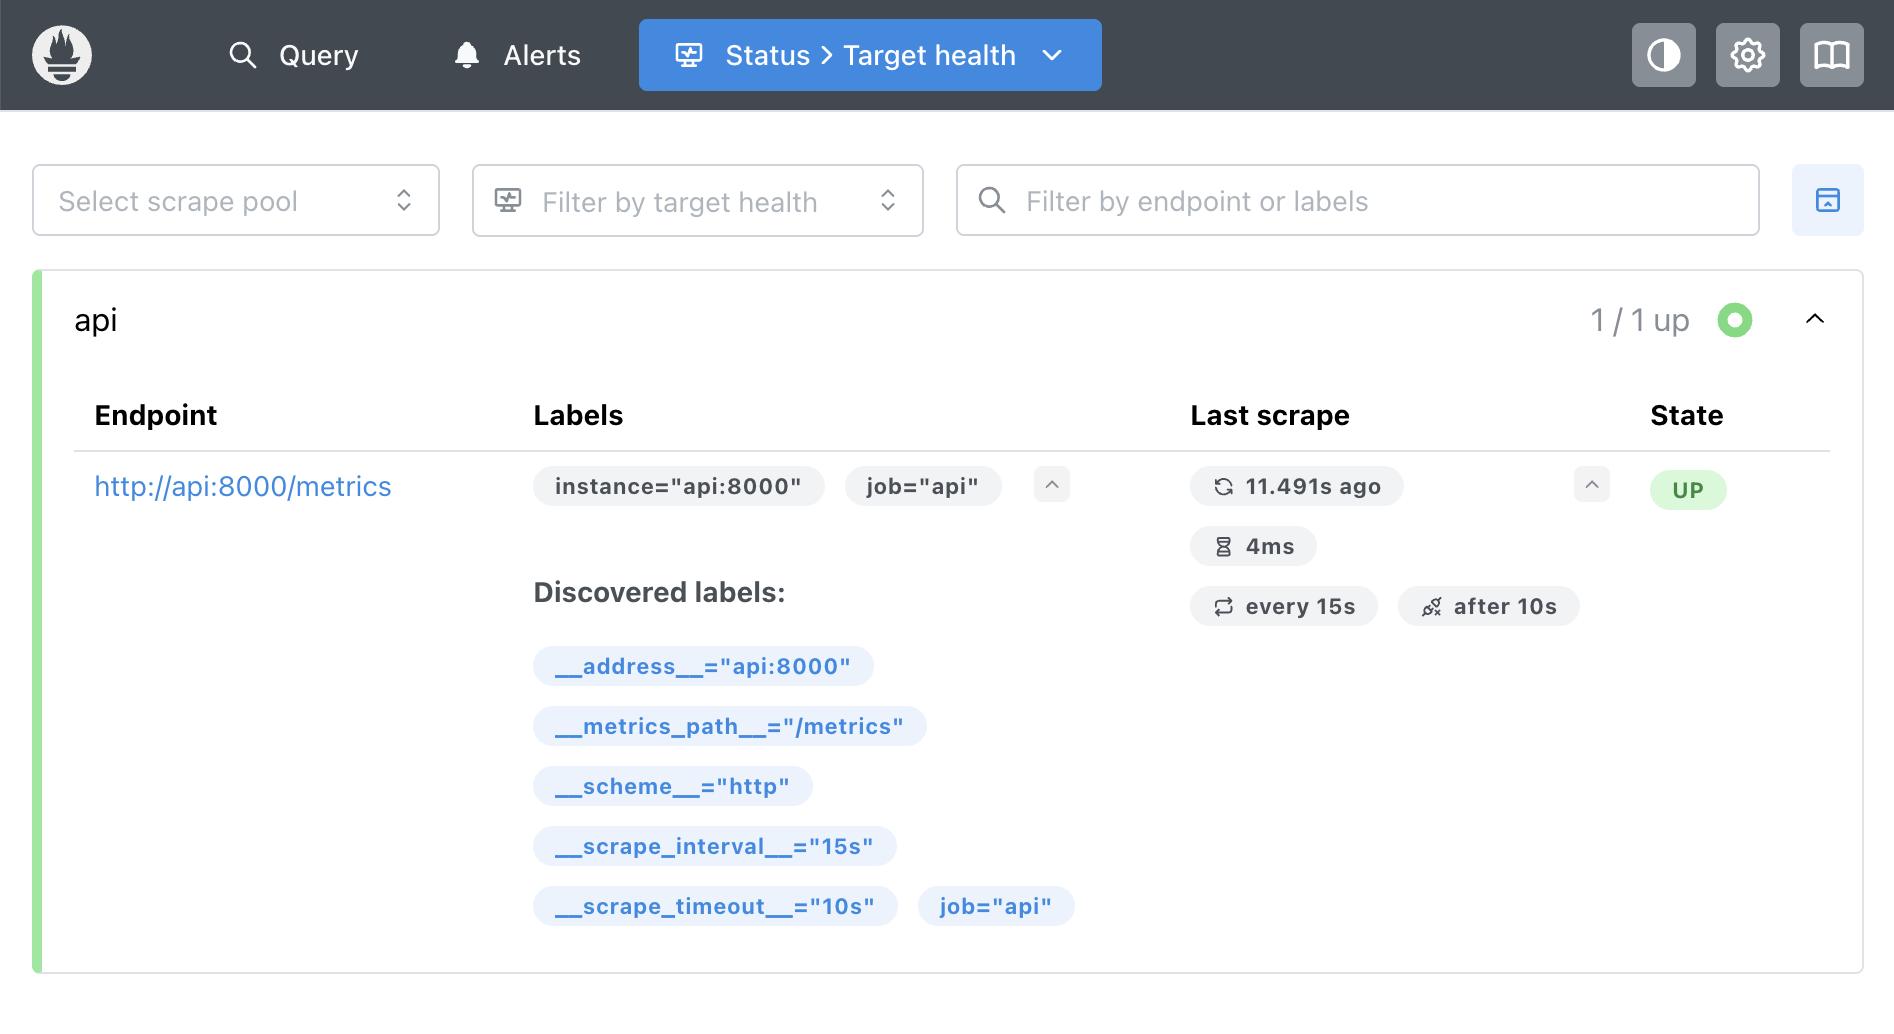 Prometheus showing that it’s actively scraping the API - three separate applications communicating over HTTP
How They’re Actually Deployed
Understanding the deployment topology is important:
prometheus-client (runs everywhere):
- Lives inside every instance of your application
- If you have 50 API servers, you have 50 instances with prometheus-client embedded
- Each exposes its own
/metricsendpoint
Prometheus (centralized):
- Typically 1-2 instances (or a small HA cluster) for your entire infrastructure
- One Prometheus can scrape hundreds or thousands of application instances
- Configuration lists all the targets to scrape
Grafana (centralized):
- Typically 1 instance (or a small HA cluster)
- One Grafana can query multiple Prometheus instances
- Shared by your entire team
The topology: N applications : 1 Prometheus (or cluster) : 1 Grafana
In our demo, we’re running everything locally (1 API, 1 Prometheus, 1 Grafana). But in production, you’d have many application instances all being scraped by one or more Prometheus instances, with a single Grafana instance for visualization. At large scale, you might use federated Prometheus or tools like Thanos/Cortex for horizontal scaling.
The Pull Model
Prometheus pulls metrics from your application (rather than your application pushing metrics to Prometheus):
Why this matters:
- Your API doesn’t need to know about Prometheus
- Prometheus controls scrape frequency
- Simple and reliable - no complex retry logic needed
- Easy to add/remove Prometheus without changing app code
Configuration example:
# prometheus/prometheus.yml
scrape_configs:
  - job_name: 'api'
    static_configs:
      - targets: ['api:8000']
    scrape_interval: 15s
What’s in Memory vs. Disk
Regardless of which language you use, the principle is the same: client libraries store metrics in memory, Prometheus persists them to disk.
In Your Application (prometheus-client)
Metrics are stored as in-memory data structures - NOT as text, NOT on disk. In Python, these are objects; in Go, they’re structs; in Java, they’re class instances. The key is: they live in RAM.
from prometheus_client import Counter

# This creates a Python object in memory
requests_total = Counter('api_requests_total', 'Total requests')

# When you increment, you're just updating a number
requests_total.inc()  # Internally: self._value = 42 → self._value = 43
That’s it. Just a float in memory. No disk writes, no database, no persistence.
What happens when your API restarts?
- All counters reset to 0
- All metrics are lost
- Your application has no memory of previous values
The /metrics Endpoint
The text format is only generated on-demand when Prometheus scrapes:
from prometheus_client import generate_latest

@app.get("/metrics")
def metrics():
    # This converts Python objects → text, fresh every time
    return Response(content=generate_latest())
When you visit http://localhost:8000/metrics, you see:
# HELP api_requests_total Total number of API requests
# TYPE api_requests_total counter
api_requests_total{endpoint="/api/data",status="success"} 42.0

# HELP api_request_duration_seconds API request latency
# TYPE api_request_duration_seconds histogram
api_request_duration_seconds_sum{endpoint="/api/data"} 6.3
api_request_duration_seconds_count{endpoint="/api/data"} 42
This is just a snapshot of what’s currently in memory. It’s generated fresh on every request.
In Prometheus (The Database)
Prometheus is where persistence happens:
Every 15 seconds:
1. Prometheus → GET http://api:8000/metrics
2. Parses the text response
3. Writes to disk: /prometheus/data/*.db

Time-series database:
  2:00:00 PM → api_requests_total = 1200
  2:00:15 PM → api_requests_total = 1247
  2:00:30 PM → api_requests_total = 1289
  ...continues for 15 days (configurable)
Prometheus stores the history so you can see trends, calculate rates, and query past data.
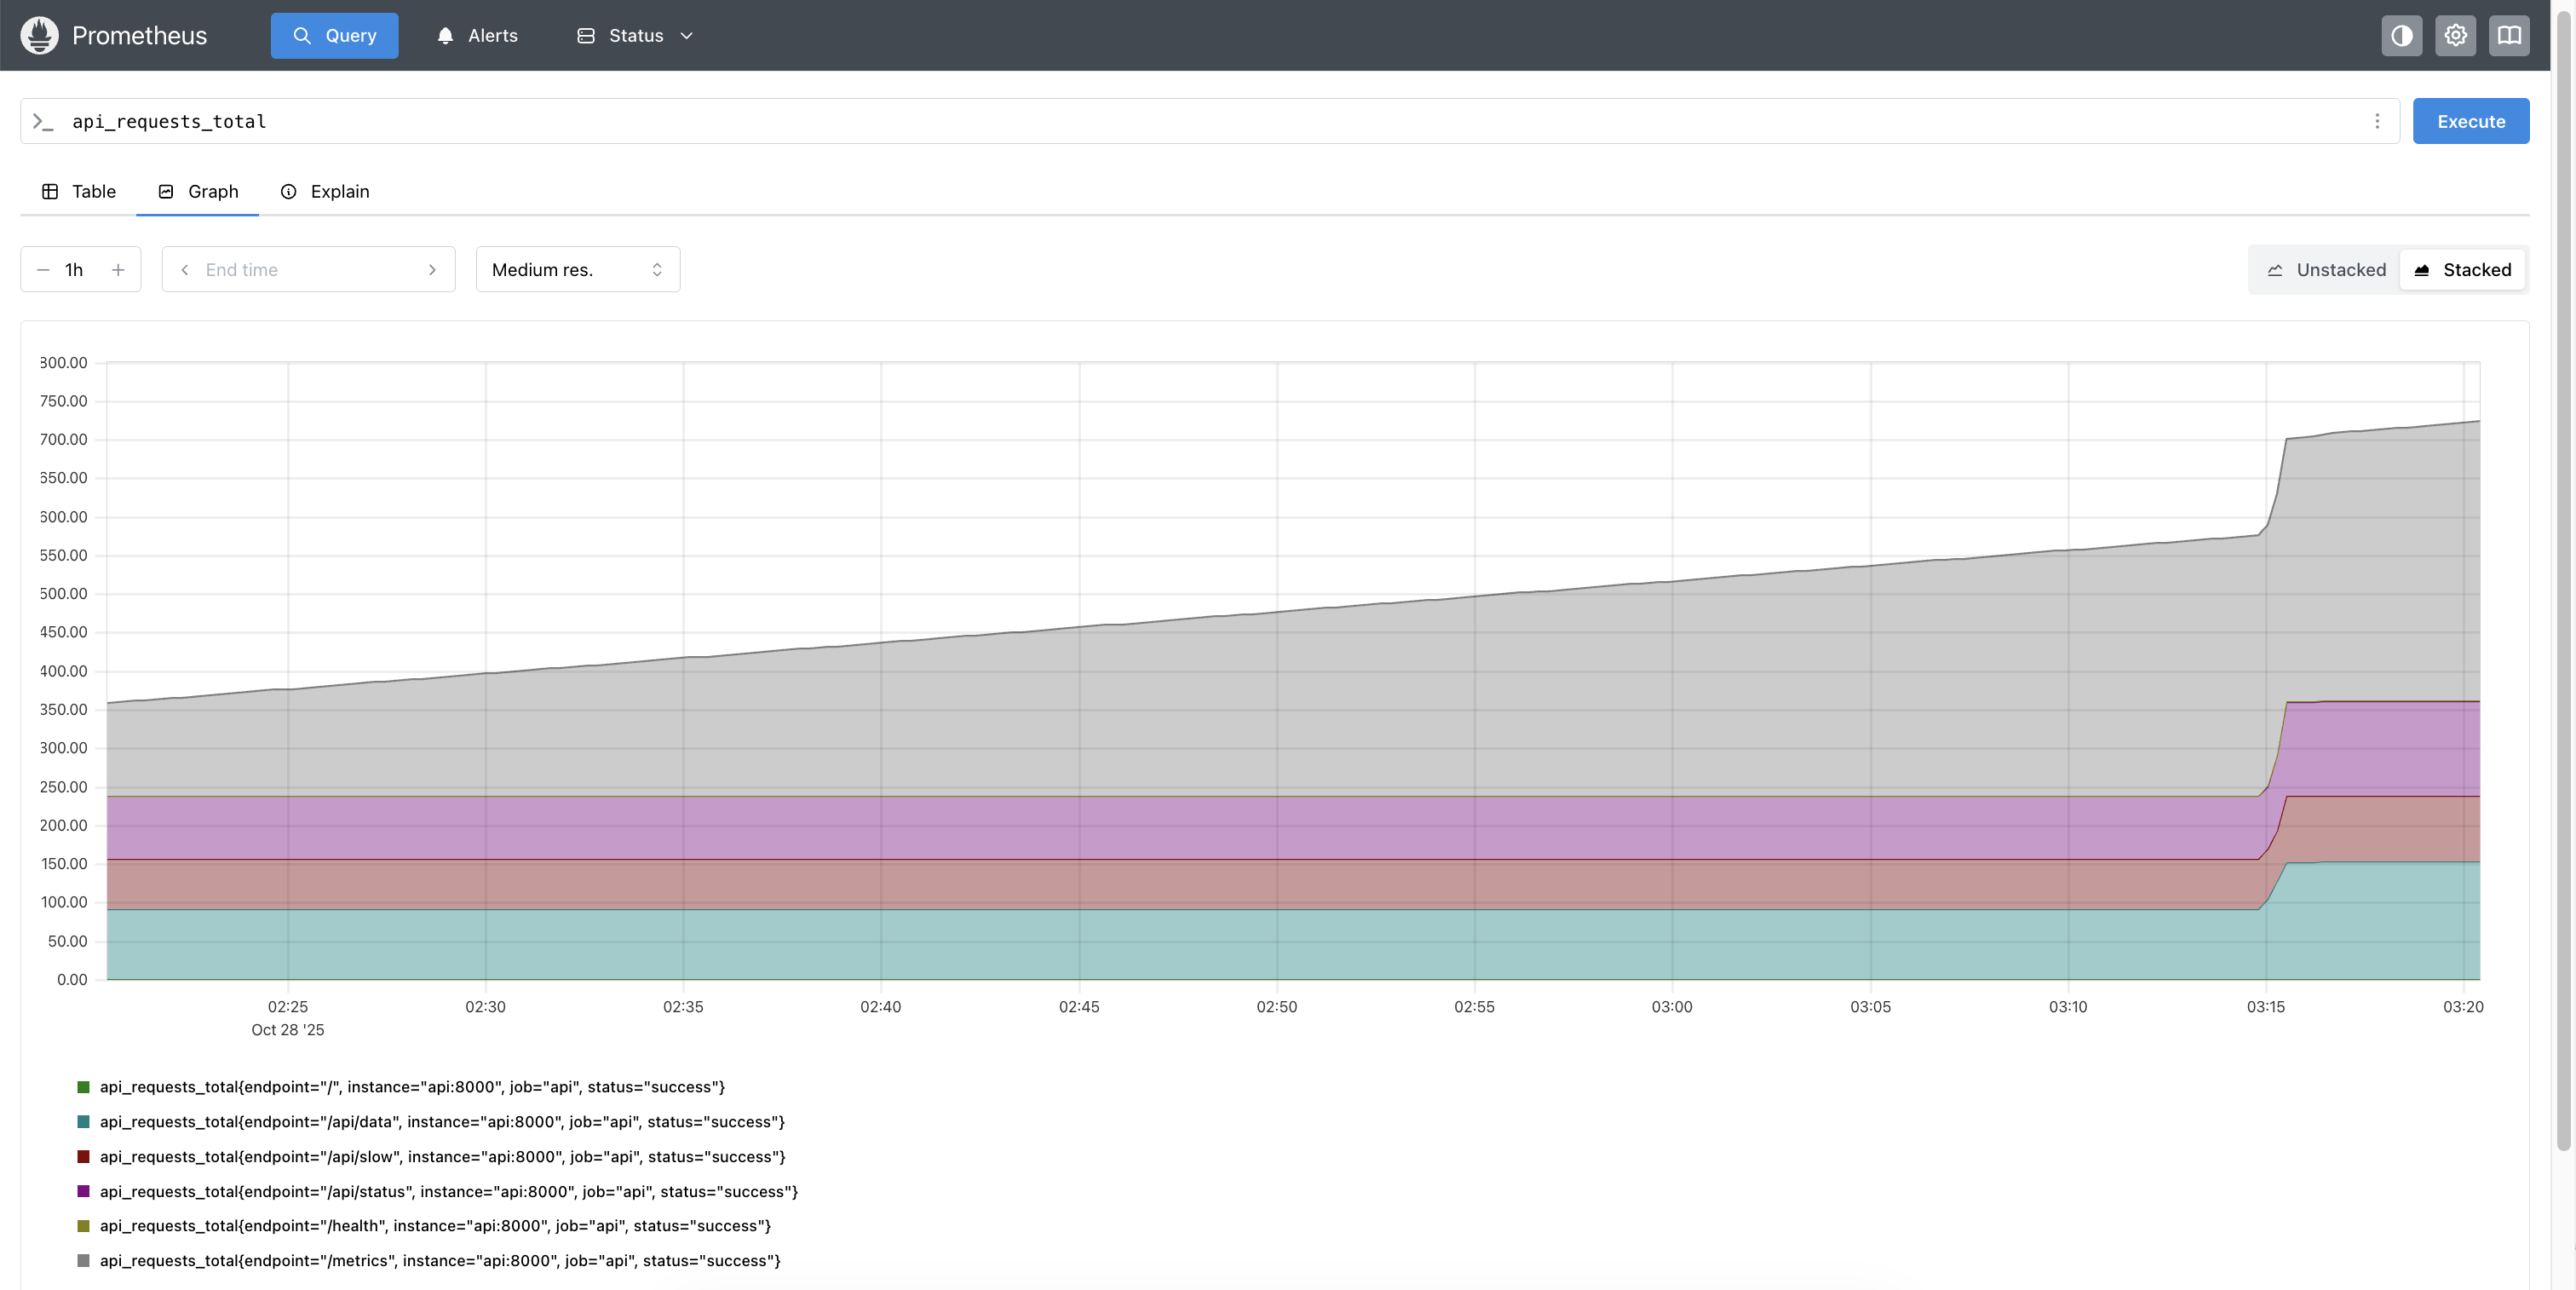 Prometheus showing time-series data - notice how it tracks changes over time
The Elegant Separation
┌──────────────────────────────┐
│ Your API (RAM only)          │
│ Current state:               │
│ requests_total = 1247        │
│                              │
│ ✗ No disk writes             │
│ ✗ No history                 │
│ ✗ Lost on restart            │
└──────────┬───────────────────┘
           │ Scrapes every 15s
           ▼
┌──────────────────────────────┐
│ Prometheus (Disk + RAM)      │
│ Time-Series Database:        │
│ 2:00:00 → requests = 1200    │
│ 2:00:15 → requests = 1247    │
│ 2:00:30 → requests = 1289    │
│                              │
│ ✓ Persisted to disk          │
│ ✓ Full history (15 days)     │
│ ✓ Survives API restarts      │
└──────────────────────────────┘
Why this is elegant:
- Your API stays fast (no disk I/O)
- Prometheus handles the hard parts (storage, retention, querying)
- If your API crashes, historical data survives
The Complete Flow
Let’s trace a single request through the entire stack:
Step 1: Request Comes In
A user hits your API endpoint. This is just your normal application code - no observability logic here:
@app.get("/api/data")
def get_data():
    # Your normal endpoint logic
    return {"data": [1, 2, 3]}
Step 2: Middleware Tracks It
Before and after your endpoint runs, middleware captures timing and updates metrics in memory:
@app.middleware("http")
async def track_metrics(request, call_next):
    start = time.time()

    response = await call_next(request)

    # Update in-memory counters
    duration = time.time() - start
    requests_total.labels(endpoint="/api/data").inc()
    request_duration.observe(duration)

    return response
What’s actually happening internally: Just updating Python variables in RAM:
# Simplified view of what happens
self._value = 42  # Now it's 43
self._sum += 0.123  # Add the duration
Step 3: Prometheus Scrapes (Every 15 Seconds)
1. Prometheus sends request:
GET http://api:8000/metrics
2. API responds:
- Runs
generate_latest() - Converts Python objects → text format
- Returns:
api_requests_total{endpoint="/api/data"} 43.0
api_request_duration_seconds_sum{...} 6.3
3. Prometheus processes:
- Parses text response
- Writes to disk
- Stores:
(timestamp: 2:00:15, metric: api_requests_total, value: 43)
The Prometheus targets page showing active scraping - notice the “UP” status and last scrape time
Step 4: Grafana Queries Prometheus
When you open a dashboard, Grafana queries historical data:
1. User action:
- Opens Grafana dashboard
2. Grafana sends query:
- Sends PromQL query to Prometheus:
rate(api_requests_total[1m])
3. Prometheus responds:
- Queries its time-series database
- Returns data points:
[(2:00:00, 0.4), (2:00:15, 0.4), (2:00:30, 0.47)]
4. Grafana renders:
- Draws the graph with the returned data
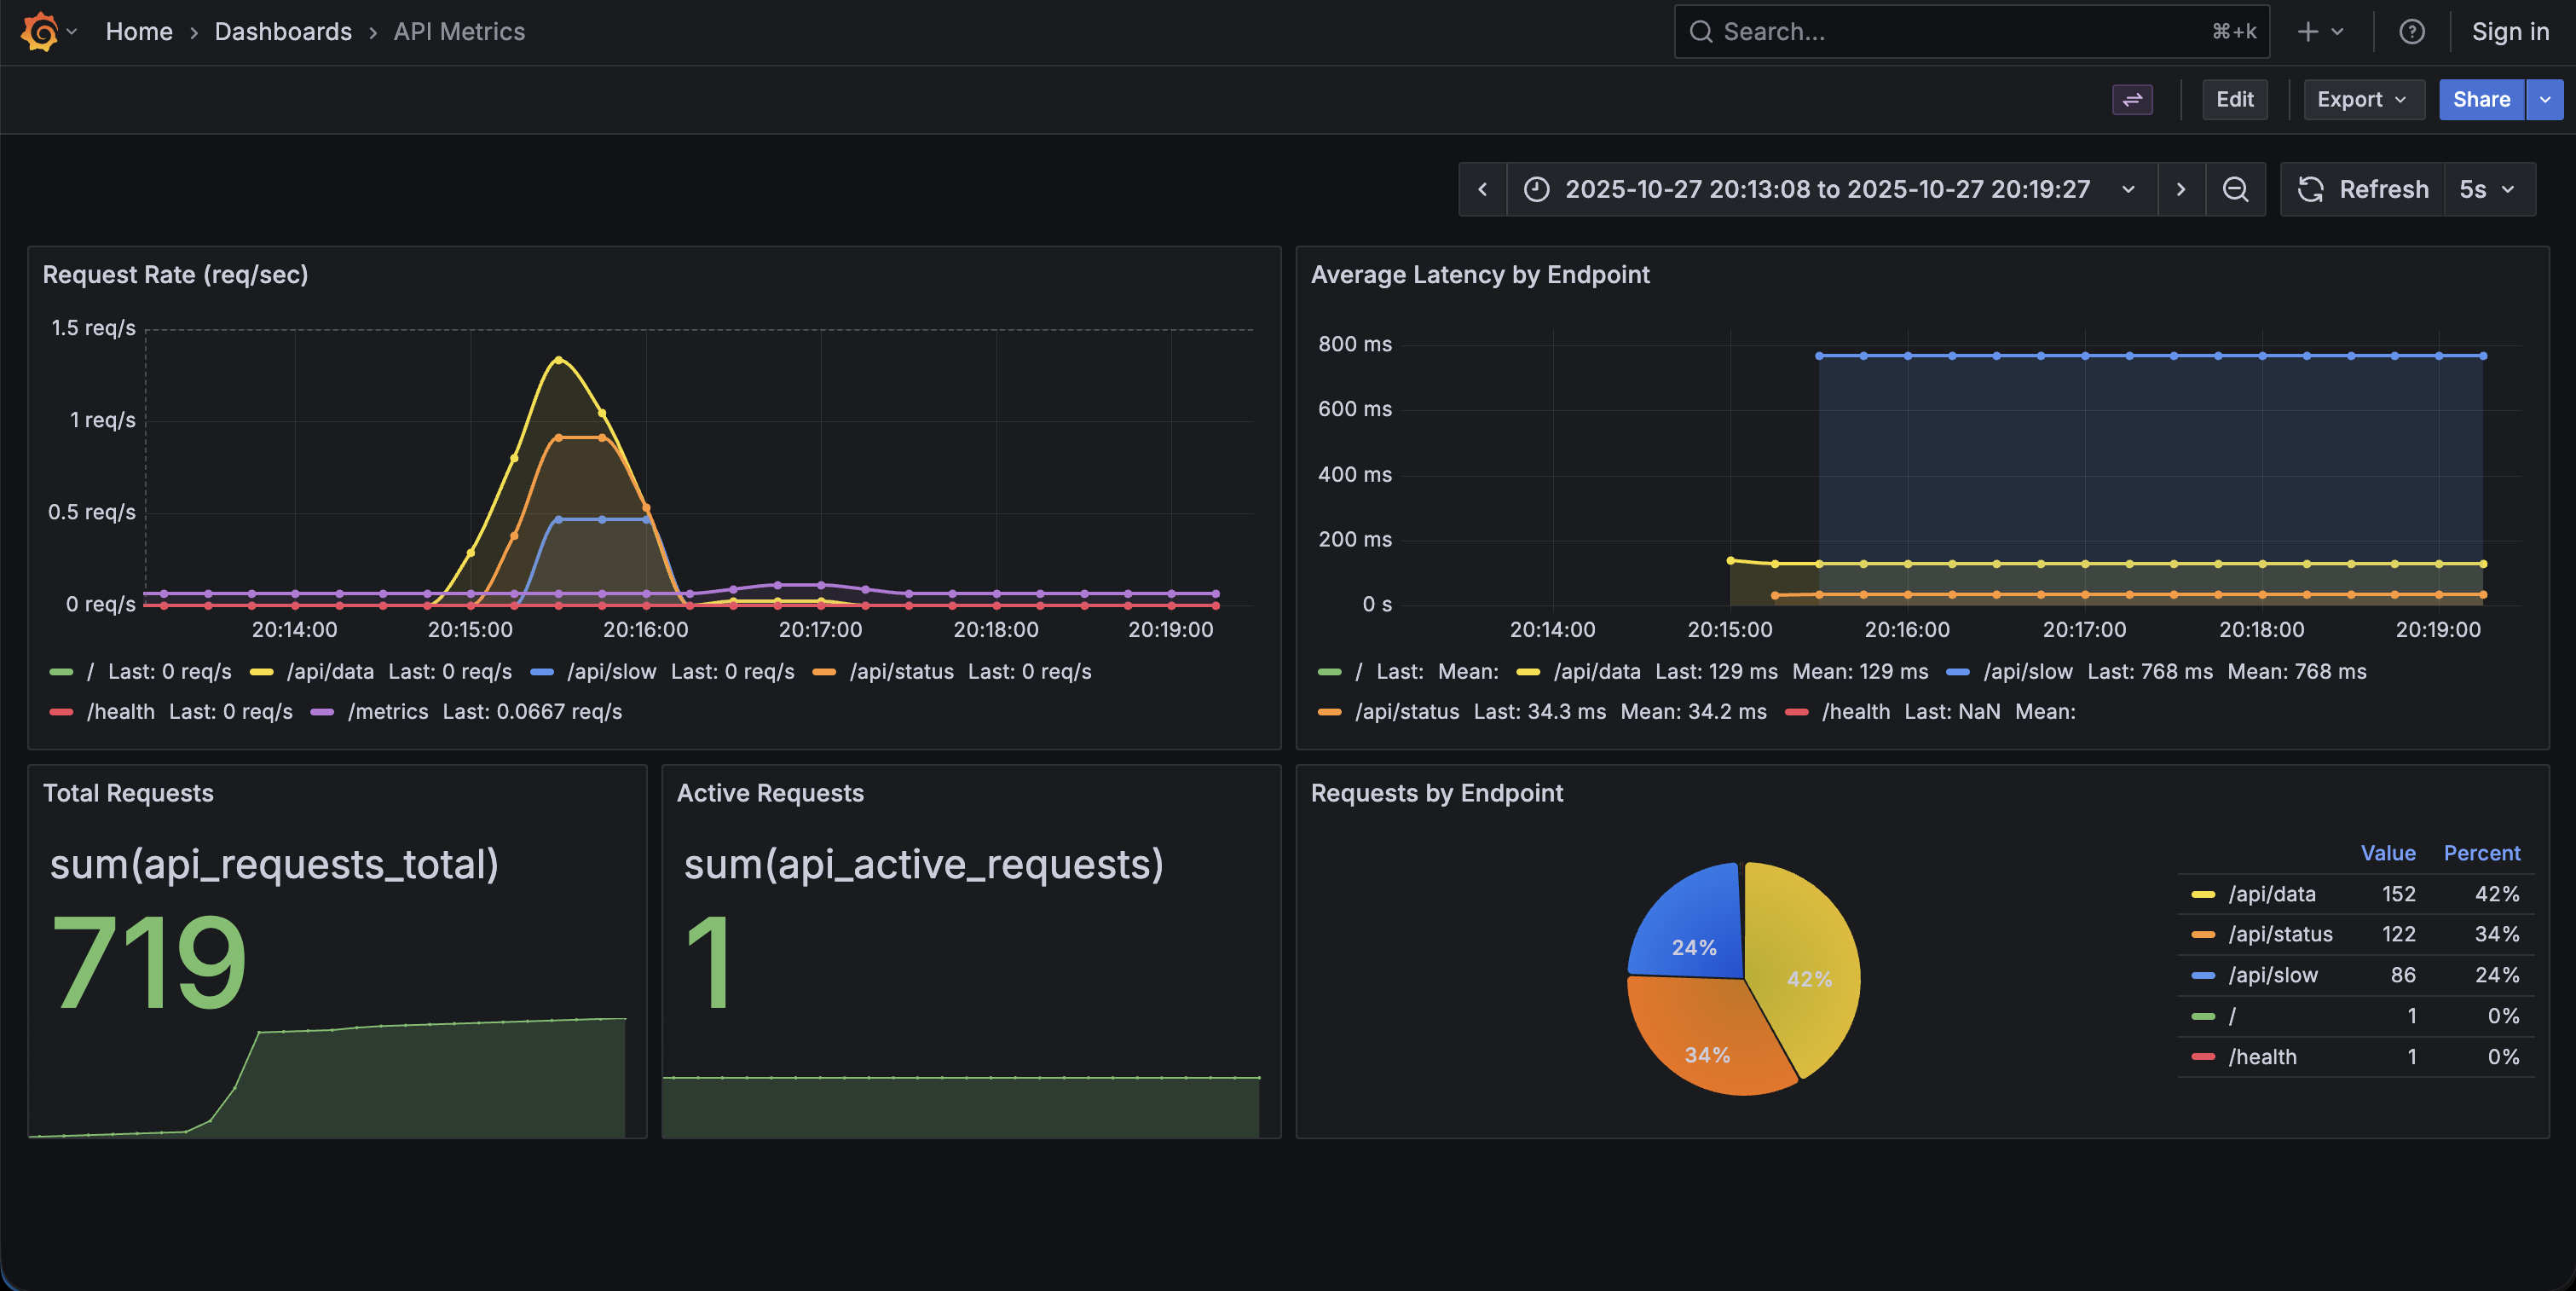 The complete Grafana dashboard showing request rate, latency, and request distribution
The API has no idea any of this is happening. It just keeps updating numbers in RAM.
Reference: Metrics and Queries
Metric Types
Counter (only goes up):
requests_total = Counter('api_requests_total', 'Total requests')
requests_total.inc()  # 0 → 1 → 2 → 3 ...
Histogram (distribution):
latency = Histogram('latency_seconds', 'Latency')
latency.observe(0.234)  # Records a single value
# Automatically creates buckets for percentile calculations
Gauge (can go up or down):
active = Gauge('active_requests', 'Active requests')
active.inc()  # Increment
active.dec()  # Decrement
PromQL Examples
PromQL (Prometheus Query Language) uses a functional syntax with built-in aggregation functions. Here are common queries you’ll use:
# Total requests
sum(api_requests_total)

# Request rate (per second)
rate(api_requests_total[1m])

# P95 latency
histogram_quantile(0.95, rate(api_request_duration_seconds_bucket[5m]))

# Average latency by endpoint
rate(api_request_duration_seconds_sum[5m])
  /
rate(api_request_duration_seconds_count[5m])
Try It Yourself
I’ve created a minimal example that demonstrates all of this: observability-starter
Get it running in 60 seconds:
git clone https://github.com/brianhliou/observability-starter
cd observability-starter
make up

# Wait ~30 seconds, then open:
# - API:        http://localhost:8000
# - Prometheus: http://localhost:9090
# - Grafana:    http://localhost:3002
The repo includes:
- Minimal FastAPI app with 4 endpoints
- Full docker-compose stack
- Pre-configured Grafana dashboard
- Load testing script
- Detailed README
What you get:
- See the
/metricsendpoint in plain text - Watch Prometheus scrape in real-time
- Generate load and see graphs update
- Three separate applications, all working together
Common Gotchas
1. Cardinality Explosion
# BAD: Unbounded labels
requests.labels(user_id=user_id).inc()  # Millions of users!

# GOOD: Bounded labels
requests.labels(endpoint=endpoint, status=status).inc()
Keep label cardinality low - dozens, not millions.
2. Counters Reset on Restart
When your API restarts, counters go to zero. Prometheus handles this with the rate() function, which calculates the per-second rate and handles resets automatically.
3. Memory Footprint
Even with millions of requests, prometheus-client uses minimal memory:
- Counter: Just a float (8 bytes)
- Histogram: Sum + count + bucket counts (~100 bytes)
The API doesn’t store individual requests - just aggregates.
When to Use This Stack
Prometheus/Grafana is a good fit if:
- You want open-source with no vendor lock-in
- You’re okay running infrastructure (Kubernetes, VMs, Docker)
- You need powerful querying (PromQL)
- Cost predictability matters (no per-host or per-metric pricing)
What Alternatives Exist
Most large tech companies use managed platforms instead:
SaaS Platforms:
- Datadog - Used by Airbnb, Peloton, Samsung
- New Relic, Dynatrace, Splunk - Popular in enterprises
Cloud-Native:
- CloudWatch (AWS), Azure Monitor, Google Cloud Operations
What they provide that Prometheus/Grafana don’t:
- Unified observability: Metrics + logs + traces in one platform (Prometheus is metrics-only)
- No infrastructure: They handle HA, scaling, backups
- Advanced features: APM, distributed tracing, anomaly detection, log analysis
- Better UX: Pre-built dashboards, faster onboarding, integrated alerting
The trade-off:
- Prometheus/Grafana: Lower cost at scale ($0 vs. $50k-500k+/year), full control, no vendor lock-in
- Managed platforms: Faster setup, more features, less operational burden
Common pattern: Many companies use both - Prometheus for internal metrics, managed platforms for application observability.
What You Learned
By now you should understand:
✓ prometheus-client stores metrics in RAM, not disk
✓ Prometheus is a separate application that scrapes and persists
✓ Grafana is another separate application that visualizes
✓ Text format is generated on-demand, not stored
✓ The pull model means your API stays simple
✓ Historical data survives API restarts
You now have the foundation to implement observability in your own applications. Clone the observability-starter repo and start experimenting.
Resources: