Building ML Serving Infrastructure
Serving ML models in production is 90% backend engineering, 10% ML. The hard part isn’t loading a model from HuggingFace. It’s designing cache keys for JSON inputs, instrumenting latency with the right labels, and testing with traffic that follows power laws instead of uniform distribution. This project applies backend infrastructure patterns to ML serving using Redis, Prometheus, Docker, and FastAPI.
Source: github.com/brianhliou/ml-serve-playground
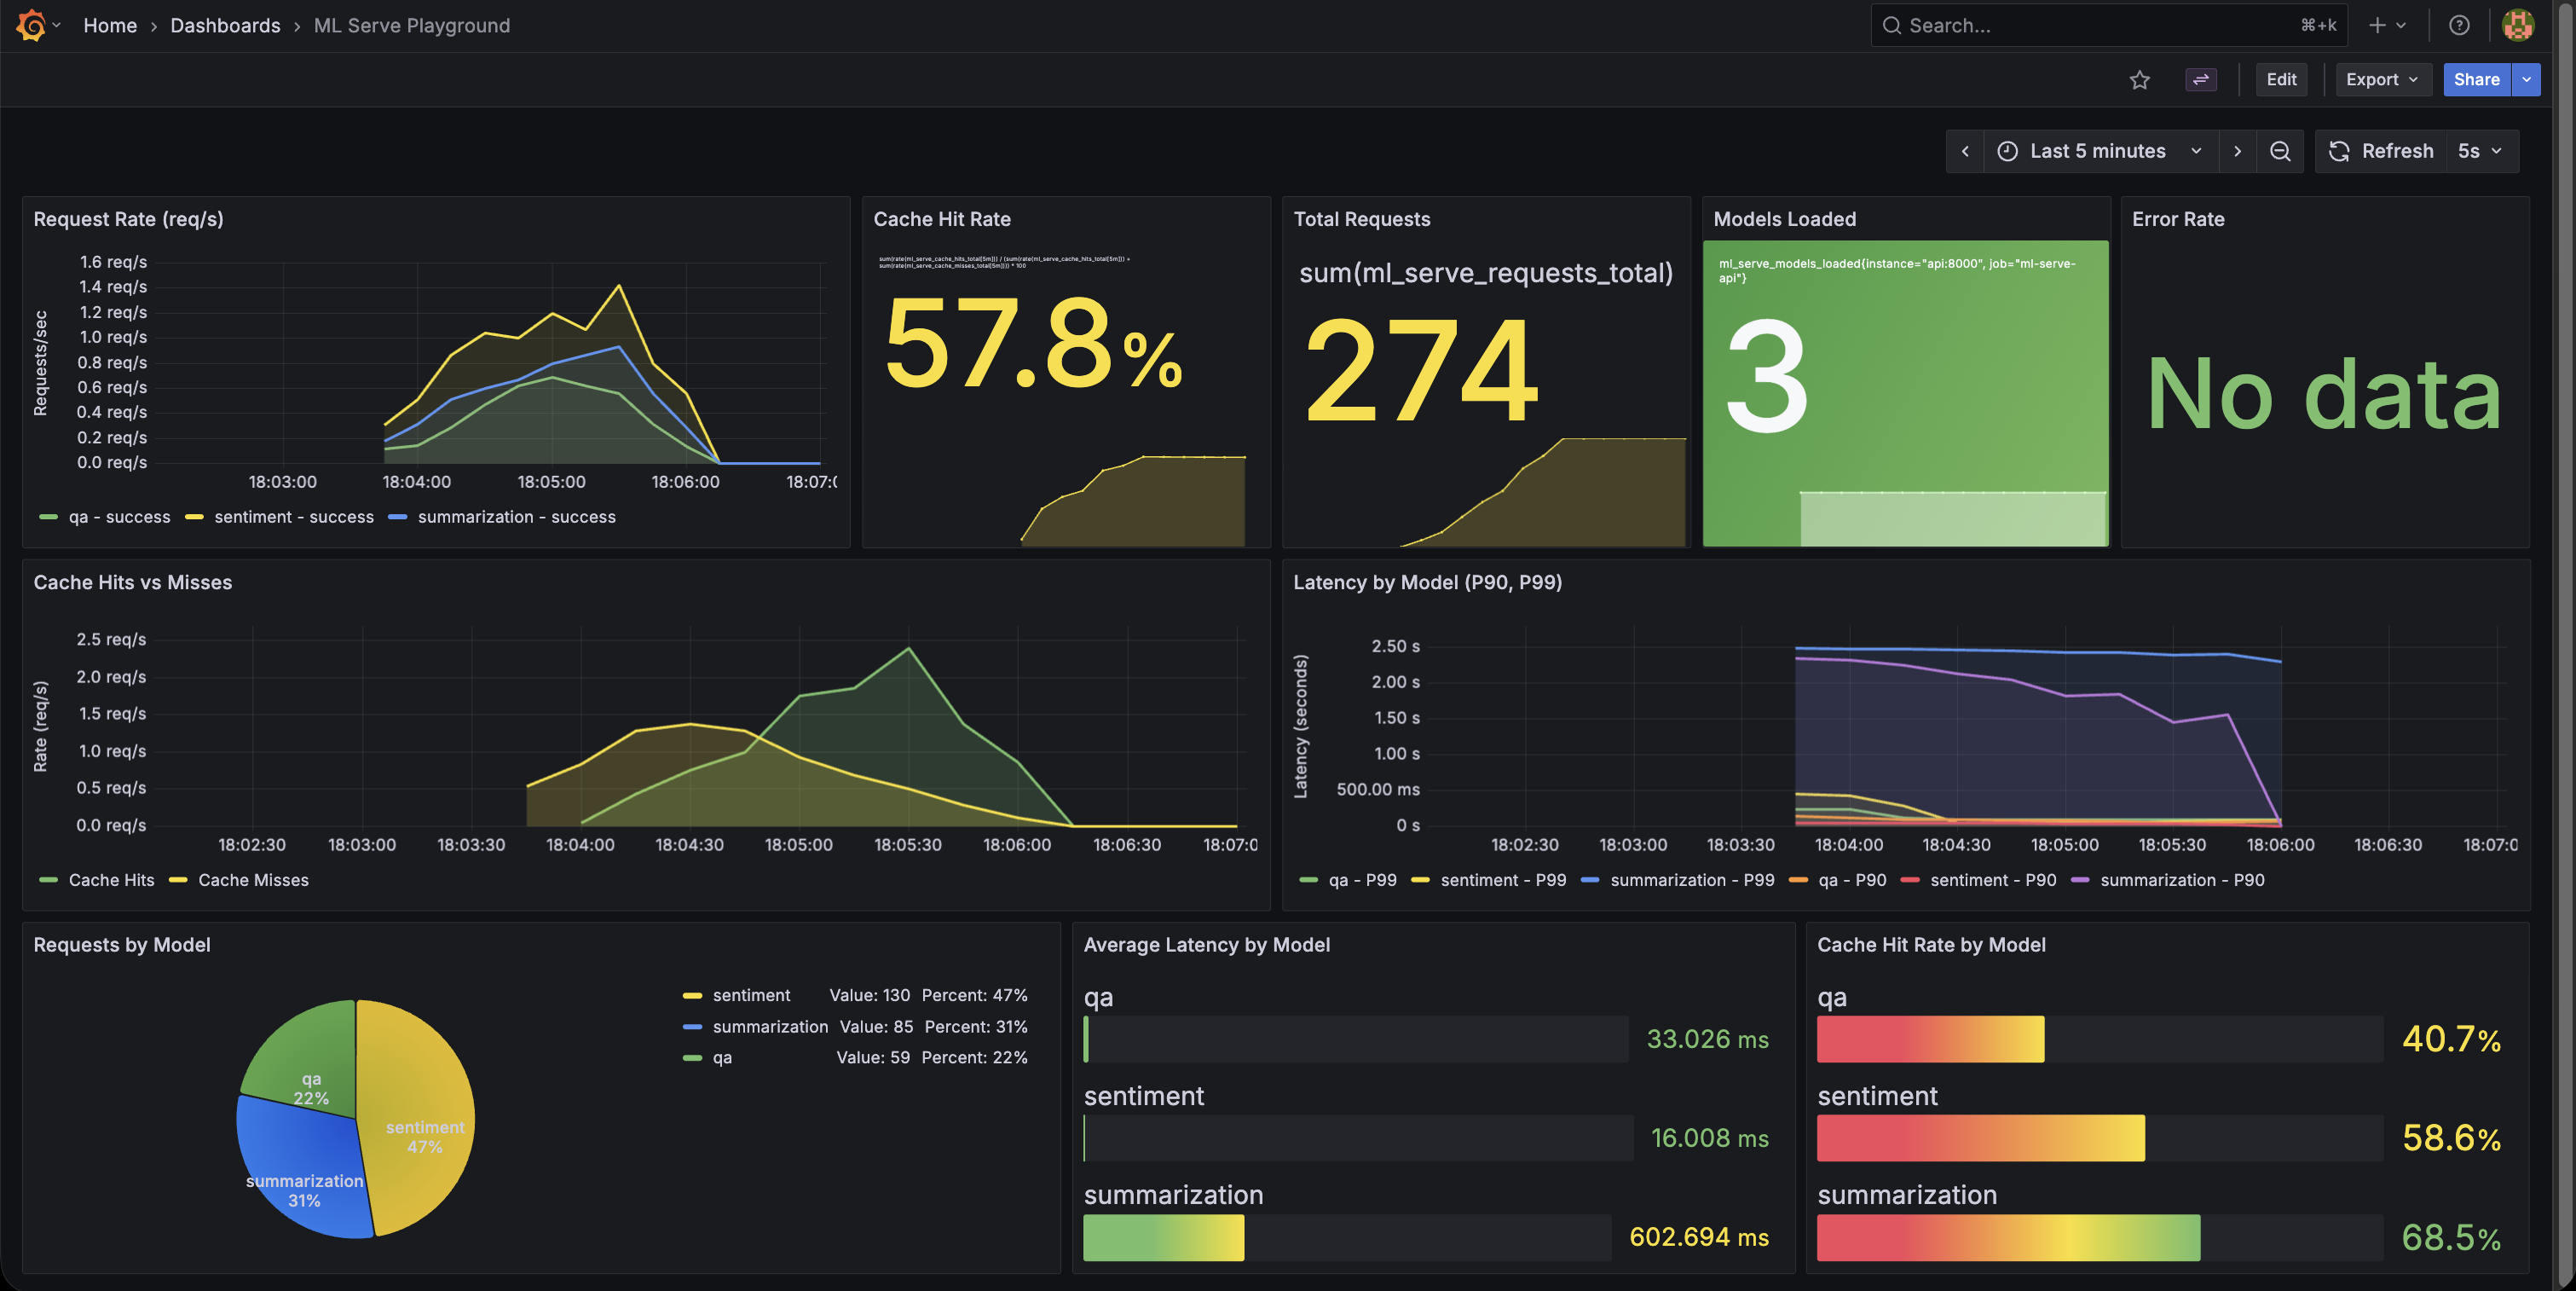 Cache hit rate climbing from 0% → 70% under realistic load, with P99 latency dropping from 1.5s to 50ms
What Is This?
Production ML serving infrastructure demonstrating observability and performance patterns. The focus is on serving infrastructure: caching strategies, metrics design, realistic load testing. The ML models themselves are pre-trained from HuggingFace.
Stack:
- Serving: FastAPI + 3 pre-trained models (sentiment, summarization, QA)
- Caching: Redis with MD5-based cache keys
- Observability: Prometheus + Grafana dashboards
- Testing: Zipf-distributed load generator
- Deployment: Docker Compose multi-service orchestration
The Problem
ML tutorials focus on models, not production patterns. But serving ML models requires the same infrastructure concerns as any backend system:
- How do you cache model predictions? Cache key design for varying inputs.
- What metrics matter? Beyond accuracy, you need latency percentiles, cache hit rates, error tracking.
- How do you test realistically? Traffic follows power laws, not uniform distribution.
- How do you observe system behavior? Dashboards showing cache warming, request patterns.
The insight: ML serving is an infrastructure problem with ML-specific constraints. Use familiar tools (Redis, Prometheus, Docker) with ML-aware patterns.
Architecture
The system follows a standard multi-tier architecture with caching and observability layers:
┌─────────────┐     ┌─────────────┐
│   FastAPI   │────▶│    Redis    │
│   (8000)    │     │   Cache     │
│             │     │   (6379)    │
│  3 Models:  │     └─────────────┘
│  - Sentiment│
│  - Summ.    │     ┌─────────────┐
│  - QA       │────▶│  Prometheus │
│             │     │   (9090)    │
│  /metrics   │     └──────┬──────┘
└─────────────┘            │
                           ▼
                    ┌─────────────┐
                    │   Grafana   │
                    │   (3002)    │
                    └─────────────┘
Request flow:
- Client sends inference request to FastAPI
- API checks Redis cache (MD5 hash of model + input)
- Cache miss? Run model inference, then store result in Redis (5min TTL)
- Cache hit? Return cached result (about 10-20x faster)
- Prometheus scrapes
/metricsendpoint every 5s - Grafana visualizes metrics in real-time
Caching Strategy
The challenge: Model inference is expensive (200-500ms per request). Repeated queries for the same input should hit cache, not re-run inference.
Cache key design:
def _cache_key(self, model: str, input_data: dict) -> str:
    # Sort for order-independence: {a:1, b:2} == {b:2, a:1}
    sorted_input = json.dumps(input_data, sort_keys=True)
    key_str = f"{model}:{sorted_input}"
    return hashlib.md5(key_str.encode()).hexdigest()
Why MD5?
- Fast hashing for cache lookups
- Collision-resistant at this scale
- Deterministic (same input = same hash)
TTL strategy:
- Fixed 5-minute TTL (simple, effective for demo)
- LRU eviction with 256MB memory limit
- Graceful degradation if Redis unavailable
Results:
| Metric | No Cache | With Cache (70-80% hit rate) | Improvement |
|---|---|---|---|
| P95 Latency | 200-500ms | 5-20ms | 10-25x faster |
| P99 Latency | 800ms-1.5s | 30-50ms | 15-30x faster |
| Cache Hit Rate | N/A | 70-80% | Steady state |
| Cache Warming | N/A | 0% → 60% in 30s | Fast ramp-up |
Note: Baseline latency is typical for these models on CPU (DistilBERT, T5-small). GPU inference would be faster (~50-100ms), but caching still provides significant wins.
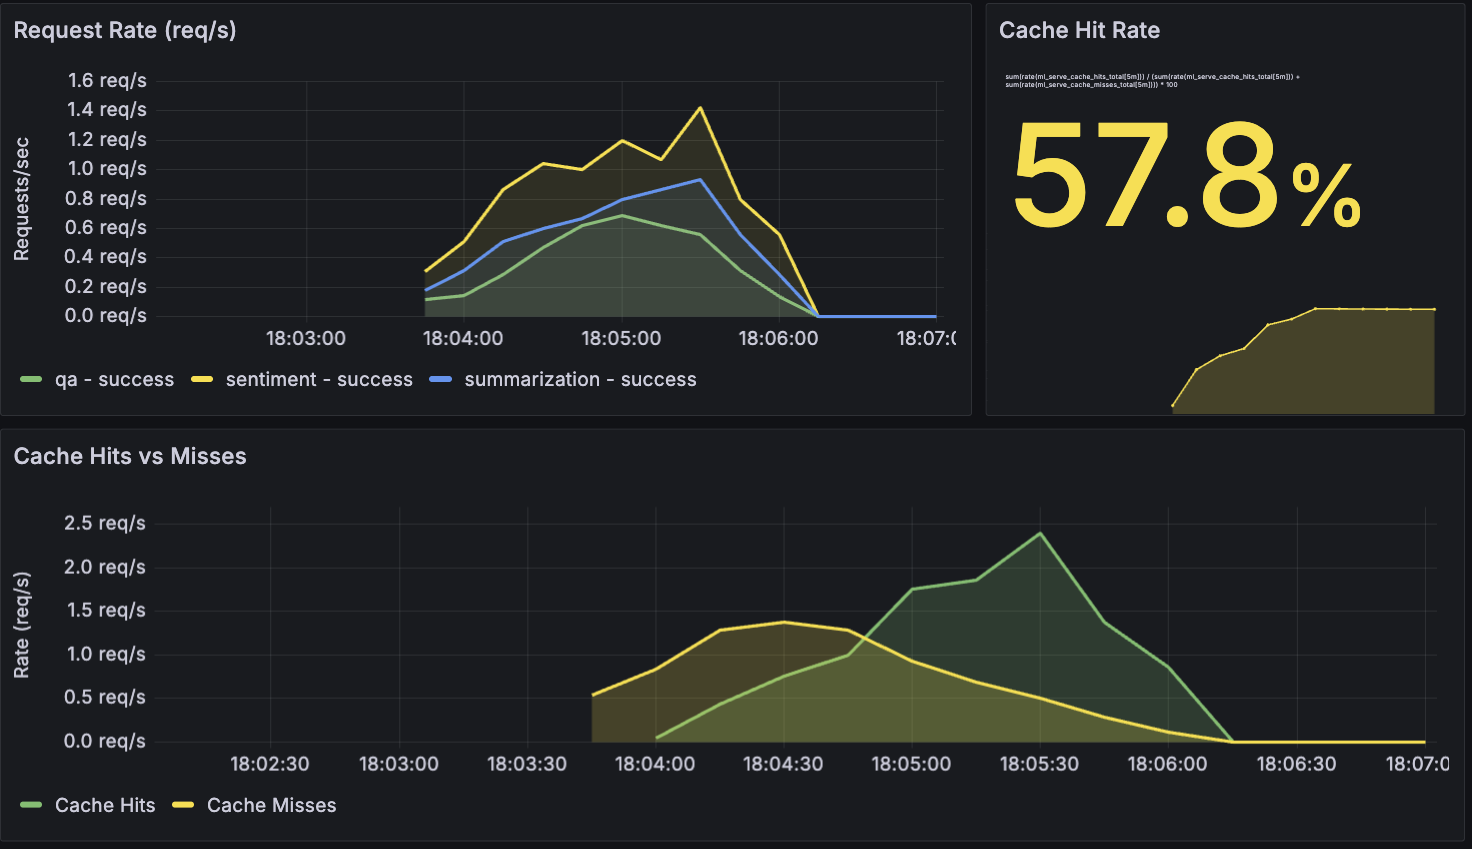 Cache hits (green) vs misses (orange) over a 2-minute load test - hit rate stabilizes at 75%
Observability Stack
Prometheus metrics design:
# Counter: total requests by model and status
requests_total = Counter(
    'ml_serve_requests_total',
    'Total requests processed',
    ['model', 'status']  # Labels for multi-dimensional queries
)

# Histogram: latency percentiles
request_latency = Histogram(
    'ml_serve_request_duration_seconds',
    'Request duration in seconds',
    ['model']
)

# Cache tracking
cache_hits = Counter('ml_serve_cache_hits_total', '', ['model'])
cache_misses = Counter('ml_serve_cache_misses_total', '', ['model'])
Why histograms for latency? They automatically calculate P50/P90/P95/P99 percentiles, which matter more than averages (averages hide tail latency). Essential for SLO monitoring in production.
Grafana dashboard features:
- 9 panels in single-screen view
- Request rates per model
- Cache warming visualization over time
- Latency percentiles by model type
- Auto-provisioned via YAML (infrastructure as code)
The dashboard is committed to the repo as JSON and automatically loaded on Grafana startup. No manual clicking through the UI required.
Realistic Load Testing
The problem: Uniform random traffic doesn’t test caching effectively. Real-world traffic follows power laws.
Zipf distribution: Top 20% of content gets 60% of requests. This models real-world access patterns (the 80/20 rule) and validates cache effectiveness under realistic load. The load generator samples from a Zipf distribution (s=1.2) across 100 unique texts per model, causing popular items to get hit repeatedly while long-tail items remain cold.
Why this matters:
With 100 unique items per model (300 total):
- Uniform distribution: Each item hit equally, so you get maybe ~1% cache hit rate
- Zipf distribution: Popular items dominate, giving you 70-80% cache hit rate
This proves the cache works for realistic traffic patterns, not just synthetic uniform loads.
Docker Orchestration
Multi-service stack:
services:
  api:        # FastAPI on port 8000
  redis:      # Cache on port 6379
  prometheus: # Metrics on port 9090
  grafana:    # Dashboards on port 3002
Volume optimization for dev experience:
Initial approach was downloading HuggingFace models on every container start. Result? 2-3 minute wait each time. Developer experience? Terrible.
Solution: Docker volume for model cache
volumes:
  huggingface-cache:
    driver: local

services:
  api:
    volumes:
      - huggingface-cache:/root/.cache/huggingface
- First start: ~2 min (download ~750MB of models)
- Subsequent starts: ~10 sec (load from volume)
- Dev experience: much better
Lesson: Infrastructure optimizations matter for developer experience, not just production performance.
Key Insights
1. ML Caching Requires Deterministic Keys
Web caching: URL is the cache key. Simple.
ML caching: Inputs are dicts/JSON with arbitrary key ordering.
# These are semantically identical but hash differently:
{"text": "hello", "max_length": 50}
{"max_length": 50, "text": "hello"}
The fix: Sort keys before hashing:
sorted_input = json.dumps(input_data, sort_keys=True)
Now {a:1, b:2} and {b:2, a:1} produce the same cache key.
Lesson: Infrastructure patterns adapt to new constraints. Caching is caching, but the details matter.
2. Observability Validates Assumptions
Zipf distribution should improve cache hit rates in theory. Grafana dashboards validated this: 70-80% hit rate with Zipf vs <10% with uniform distribution.
The visualization also surfaced non-obvious behavior:
- Cache warming pattern (0% to 60% in first 30 seconds)
- P99 latency spikes when cache is cold
- Different models have different latency profiles
Lesson: Metrics aren’t just monitoring. They’re feedback on your architecture decisions. Build observability early.
3. Infrastructure as Code for Dashboards
Problem: Manually created Grafana dashboards don’t persist across container restarts.
Solution: Commit dashboard JSON to repo and auto-provision:
grafana/
├── provisioning/
│   ├── datasources/prometheus.yml  # Auto-configure Prometheus
│   └── dashboards/dashboards.yml   # Auto-load dashboards
└── dashboards/
    └── ml-serve-dashboard.json     # Dashboard definition
Now docker-compose up gives you a fully configured Grafana with dashboards ready.
Lesson: Treat observability config like application code. Version control it, make it reproducible, make it reviewable.
4. FastAPI Lifespan Pattern
Upgraded from deprecated @app.on_event("startup") to modern lifespan pattern:
from contextlib import asynccontextmanager

@asynccontextmanager
async def lifespan(app: FastAPI):
    # Startup: load models into memory
    global model_registry, inference_cache
    model_registry = get_registry()  # Loads 3 models (~750MB)
    inference_cache = get_cache()
    yield
    # Shutdown: cleanup if needed

app = FastAPI(lifespan=lifespan)
Benefits:
- Cleaner than decorators
- Testable (TestClient triggers lifespan automatically)
- Supports async startup/shutdown
Lesson: Framework deprecations often signal better patterns. The FastAPI team deprecated on_event for good reasons (better testability and clarity).
Tech Stack
Backend Infrastructure:
- FastAPI 0.115.6 - Async Python web framework
- Redis 5.2.1 - Response caching with TTL and LRU eviction
- Docker Compose - Multi-container orchestration
Observability:
- Prometheus 2.x - Time-series metrics collection
- Grafana 11.x - Visualization and dashboards
- prometheus-client - Python instrumentation library
ML Components:
- PyTorch 2.6.0 - Inference runtime
- Transformers 4.48.0 - Pre-trained models (DistilBERT, T5-small)
- HuggingFace Hub - Model distribution and caching
Testing:
- Pytest - 24 unit tests covering API, caching, and models
- Bash + curl - Load testing with Zipf distribution
Challenges & Solutions
Challenge 1: Apple Silicon PyTorch Stability
Problem: Native ARM64 builds had sporadic crashes during model loading on M-series Macs.
Solution: Use x86_64 emulation in Dockerfile:
FROM --platform=linux/amd64 python:3.9-slim
Tradeoff: Slower inference (Rosetta emulation overhead) but reliable. For infrastructure-focused work, reliability beats speed.
Challenge 2: Test Failures After FastAPI Upgrade
Problem: 24 tests failed after migrating from @app.on_event to lifespan pattern.
Root cause: TestClient wasn’t triggering model loading, so tests ran against an uninitialized app.
Solution: Use TestClient as context manager:
@pytest.fixture(scope="session")
def client():
    with TestClient(app) as client:
        yield client  # Automatically calls lifespan startup/shutdown
Lesson: Framework upgrades require understanding new patterns, not just mechanical code changes.
Challenge 3: Grafana Dashboard Provisioning
Problem: Manually creating dashboards in Grafana UI doesn’t survive container restarts.
Solution: Export dashboard JSON, commit to repo, configure auto-provisioning:
# grafana/provisioning/dashboards/dashboards.yml
apiVersion: 1
providers:
  - name: 'default'
    folder: ''
    type: file
    options:
      path: /etc/grafana/dashboards
Result: make up gives you dashboards instantly, no clicking through UI.
What This Demonstrates
✅ Infrastructure Skills:
- Production API design (FastAPI, Pydantic validation, async/await)
- Caching strategies (Redis, cache key design, TTL policies, LRU eviction)
- Metrics instrumentation (Prometheus counters/histograms, label design)
- Performance optimization (10-20x latency reduction via caching)
- Multi-service orchestration (Docker Compose, volume management)
- Realistic load testing (Zipf distribution, not uniform traffic)
- Infrastructure as code (Grafana provisioning, reproducible setup)
✅ ML Platform Context:
- Serving pre-trained models at scale
- ML inference caching patterns (input normalization, TTL strategies)
- Observability for ML systems (latency percentiles, cache warming)
- Production deployment patterns for ML APIs
❌ What This Isn’t:
- Model training or fine-tuning (using off-the-shelf HuggingFace models)
- ML algorithm development (no custom architectures)
- Deep learning research (no novel techniques)
- Feature engineering or data pipeline work
Positioning: Infrastructure-first approach to ML serving. Using familiar DevOps tools (Docker, Redis, Prometheus, Grafana) to build production patterns around ML models.
Try It Out
Quick start (5 minutes):
git clone https://github.com/brianhliou/ml-serve-playground
cd ml-serve-playground
make up         # Start full stack (API, Redis, Prometheus, Grafana)

# First run: ~2 min to download models (~750MB)
# Subsequent runs: ~10 sec (models cached in Docker volume)

make loadgen    # Run 2-min load test with Zipf distribution
Explore the system:
- Grafana dashboards: http://localhost:3002 (admin/admin)
- Navigate to “ML Serve Playground” dashboard
- Watch cache hit rate, request rates, latency percentiles
- Watch cache warming in action:
make clean-metrics # Clear cache and metrics make loadgen # Run load test # Observe in Grafana: cache hit rate climbs from 0% → 70% - Try the models: http://localhost:8000
- Web UI for sentiment analysis, summarization, question answering
- Watch requests appear in Grafana in real-time
- Raw Prometheus metrics: http://localhost:8000/metrics
- See the metrics that Prometheus scrapes
- Understand counter/histogram formats
What to observe:
- P99 latency drops as cache warms up
- Zipf distribution creates natural cache warming (popular items hit repeatedly)
- Different models have different latency profiles
- Cache hit rate stabilizes around 70-80% (realistic traffic pattern)
Future Enhancements
Ideas for extending this project (not implemented, but could be interesting):
- Micro-batching for GPU efficiency (batch multiple concurrent requests)
- Request queuing to handle traffic spikes gracefully
- Model versioning for A/B testing different model versions
- Horizontal scaling with multiple API replicas behind a load balancer
- Adaptive TTL where cache duration depends on model confidence scores
- Circuit breakers to fail fast when downstream services are unhealthy
Conclusion
ML infrastructure is 90% systems engineering, 10% ML. The hard parts are:
- Designing cache keys that handle input variation (order-independence, normalization)
- Instrumenting requests with labels that enable useful queries (model type, status codes)
- Testing with realistic traffic patterns (Zipf distribution, not uniform random)
- Provisioning dashboards that survive container restarts (infrastructure as code)
This project demonstrates that infrastructure skills transfer. Redis, Prometheus, Docker, FastAPI - these are familiar tools. ML serving adds new constraints (cache key normalization for varying inputs, model warm-up time, inference latency), but the fundamental patterns are the same.
Key takeaway: Backend engineering skills transfer directly to ML infrastructure. The models can be pre-trained off-the-shelf. The infrastructure—production patterns, observability, performance optimization, testing methodology—is where existing expertise applies.