I Built an AI System That Synthesizes Stock Intelligence
Every analyst has an opinion on the market. Almost none of them show you the data behind it, update it as new information comes in, or tell you when they were wrong.
The problem with market analysis today isn’t a lack of information. It’s a lack of synthesis. There are dozens of sources covering any major stock: earnings reports, insider trades, analyst ratings, SEC filings, news articles. Nobody’s reading all of them. And the analysts who do form opinions rarely tie them to specific, timestamped, falsifiable claims.
I wanted to test something: if you point AI at the full firehose of financial news and force it to take structured positions backed by specific data, can it produce better intelligence than reading five articles? So I built a system to find out.
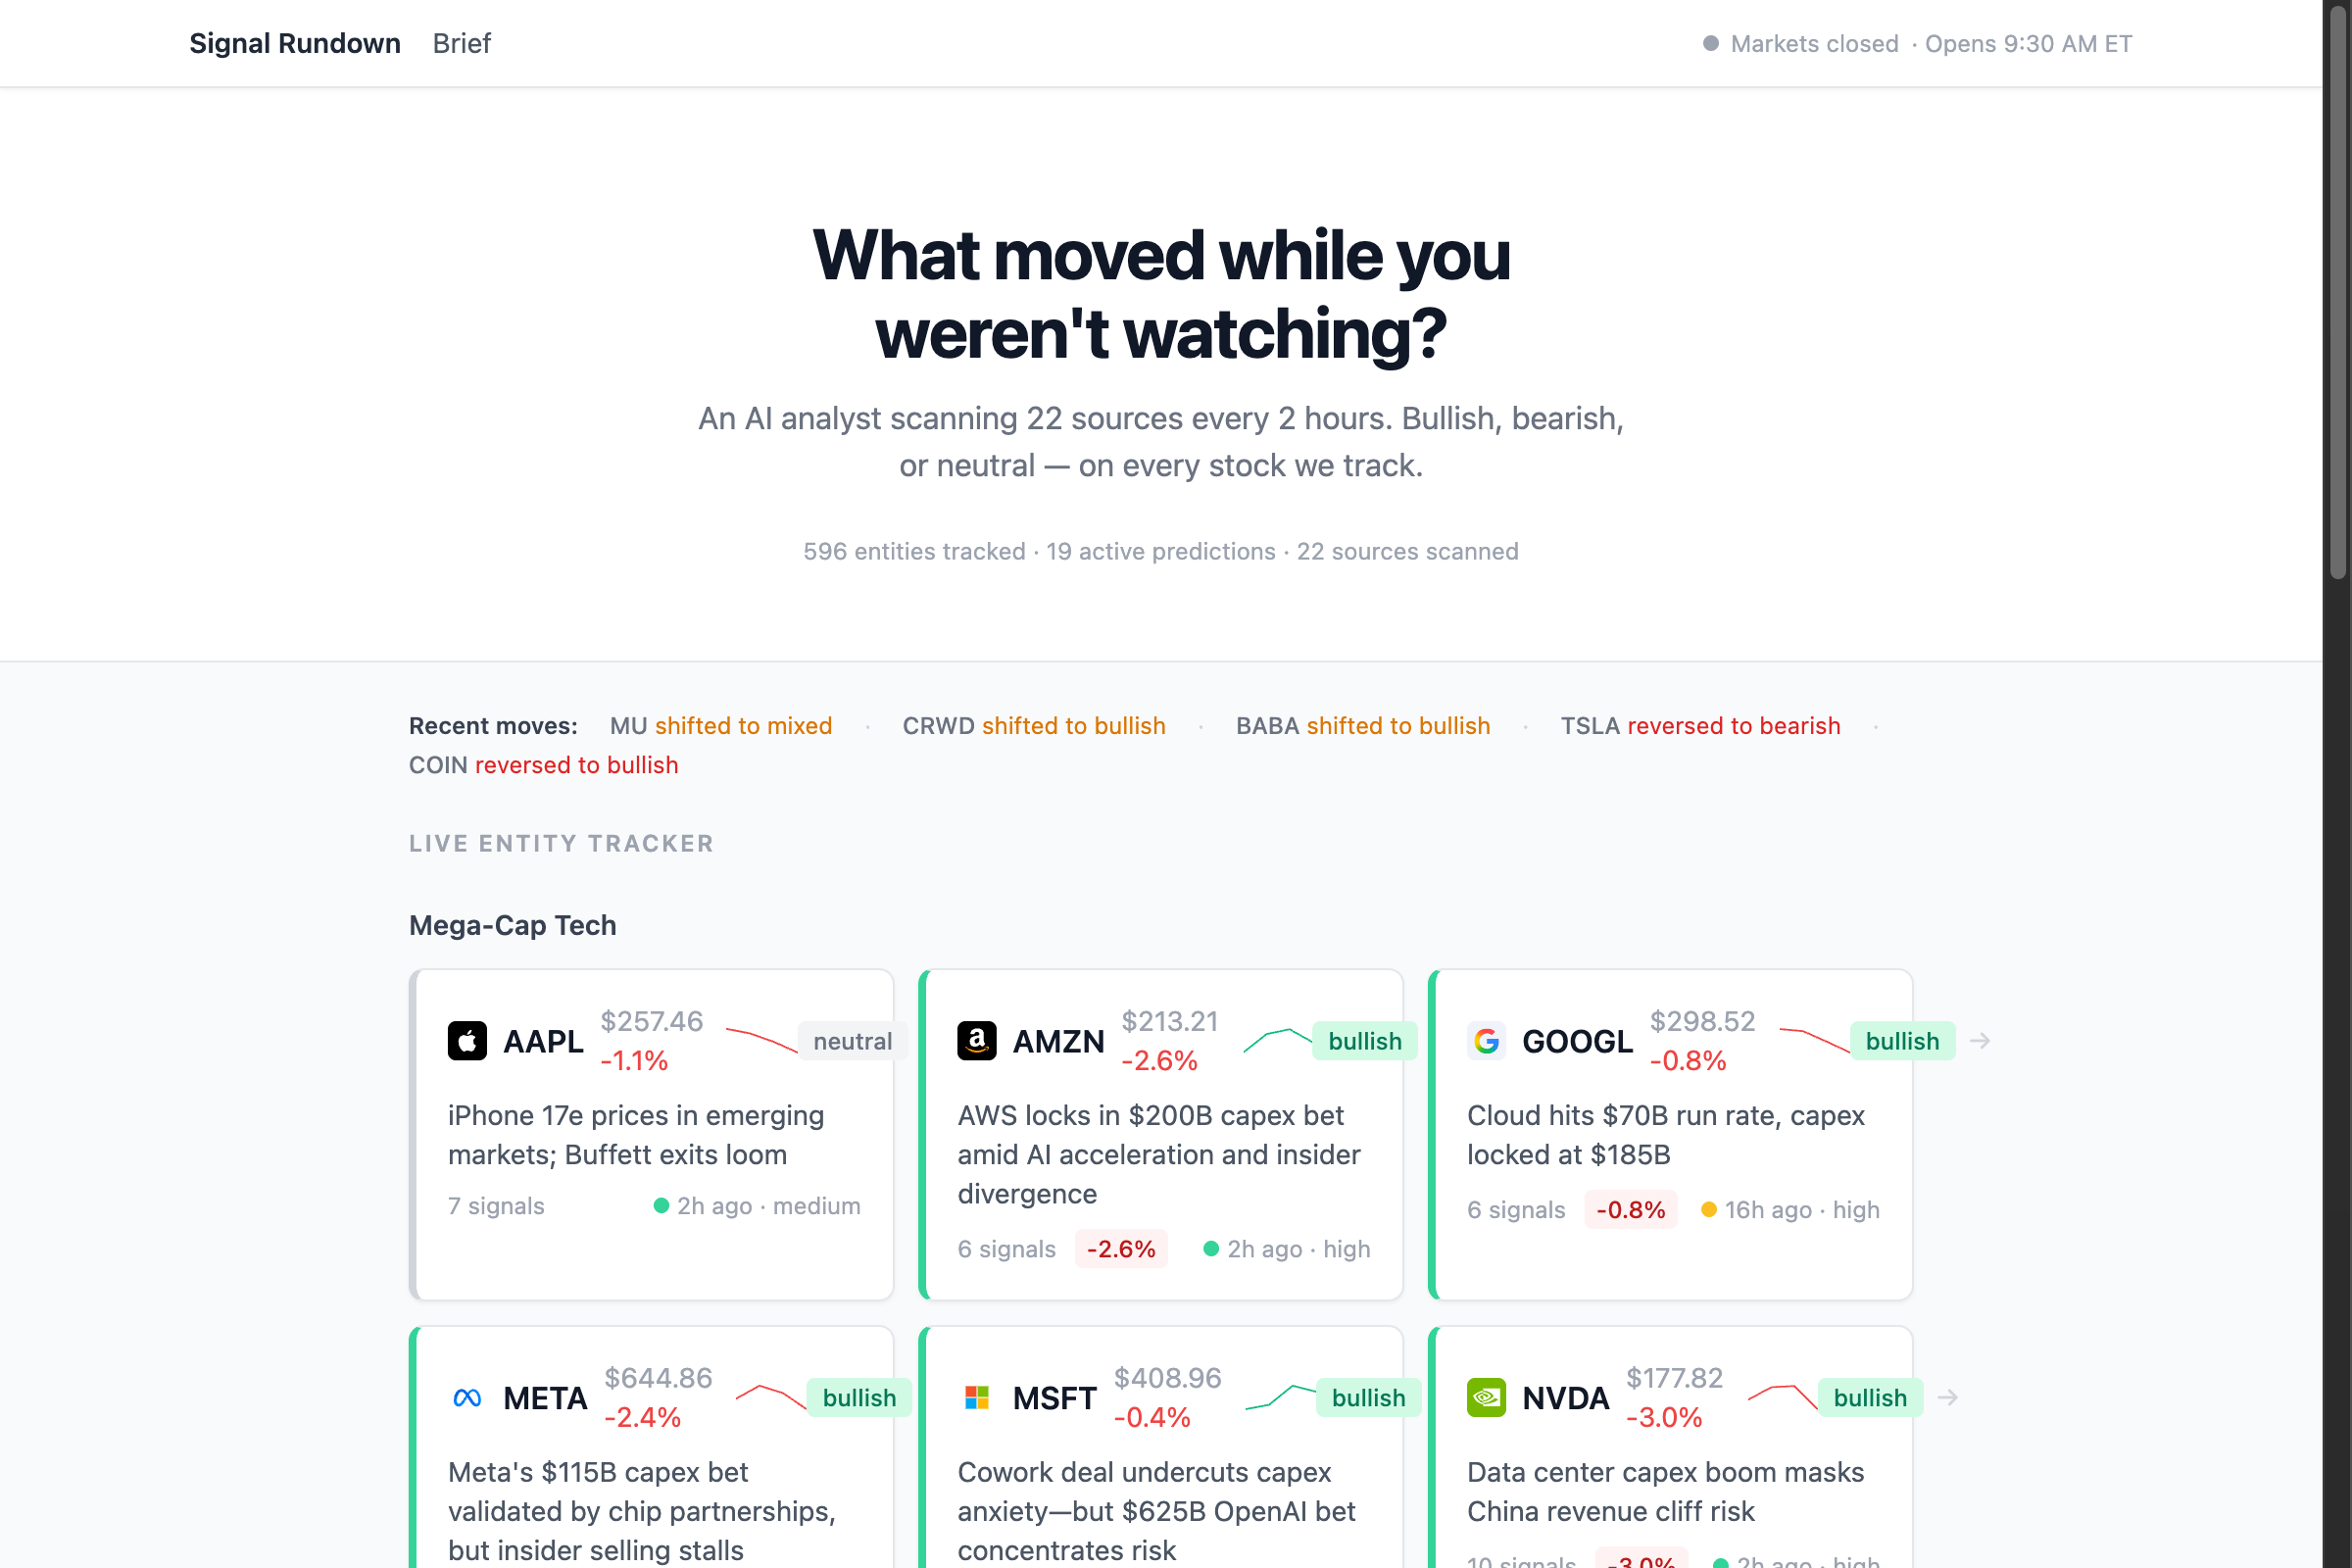
Signal Rundown is an AI that reads dozens of financial sources every 2 hours, maintains explicit bullish/bearish/neutral positions on every stock it tracks, and surfaces the data behind each call. Insider trades, analyst ratings, earnings data, direction changes, all synthesized into what actually matters.
What It Actually Does
Signal Rundown is not a chatbot and not a news aggregator. It’s a signal extraction and synthesis system that runs continuously.
Every 2 hours, the system pulls from dozens of sources (RSS feeds, Google News, financial data APIs) and filters aggressively, because most financial news is noise. The articles that survive get their full text extracted and run through LLMs that break each one down into structured signals: direction, key facts, sentiment, which companies are affected.
This matters because raw articles are ambiguous. A single earnings report might be bullish for the company, bearish for a competitor, and neutral for the sector. The extraction step forces a position.
Those signals accumulate into entity states: a rolling analytical position per stock that updates as new evidence arrives. Each entity state includes a direction, a headline thesis, the key data points driving the call, and what to watch next. When a major event approaches, like earnings, the system generates predictions with a specific direction, baseline price, and expected move range.
The tech stack is Python, PostgreSQL, and LLMs. The whole system runs on a single Railway instance for about $30/month. Collection happens every 2 hours from 5 AM, entity states update on the same cadence, and the dashboard updates continuously.
What Makes It Different
Most analysis is stateless. Someone publishes a take, it floats around for a day, and it’s forgotten. Nobody checks whether it was right.
Signal Rundown works more like a real analyst: it maintains views, updates them as evidence changes, and shows you exactly what data drove each position. Every entity has a living analytical state that accumulates evidence over time. When the system flips from bullish to bearish, that shift is logged with the specific signals that caused it.
The difference is synthesis at scale. Signal Rundown does this across dozens of stocks simultaneously, processes information in minutes instead of days, and never has a bad Monday. For each stock, you see not just “bullish” or “bearish” but the insider trades, analyst ratings, earnings data, and news signals that support the call.
The other key decision: predictions are first-class objects, not chat responses. Each prediction records a baseline price, an expected move range, and a target event. After the event, the system scores the prediction against the actual price. The track record is public and permanent.
What It Looks Like
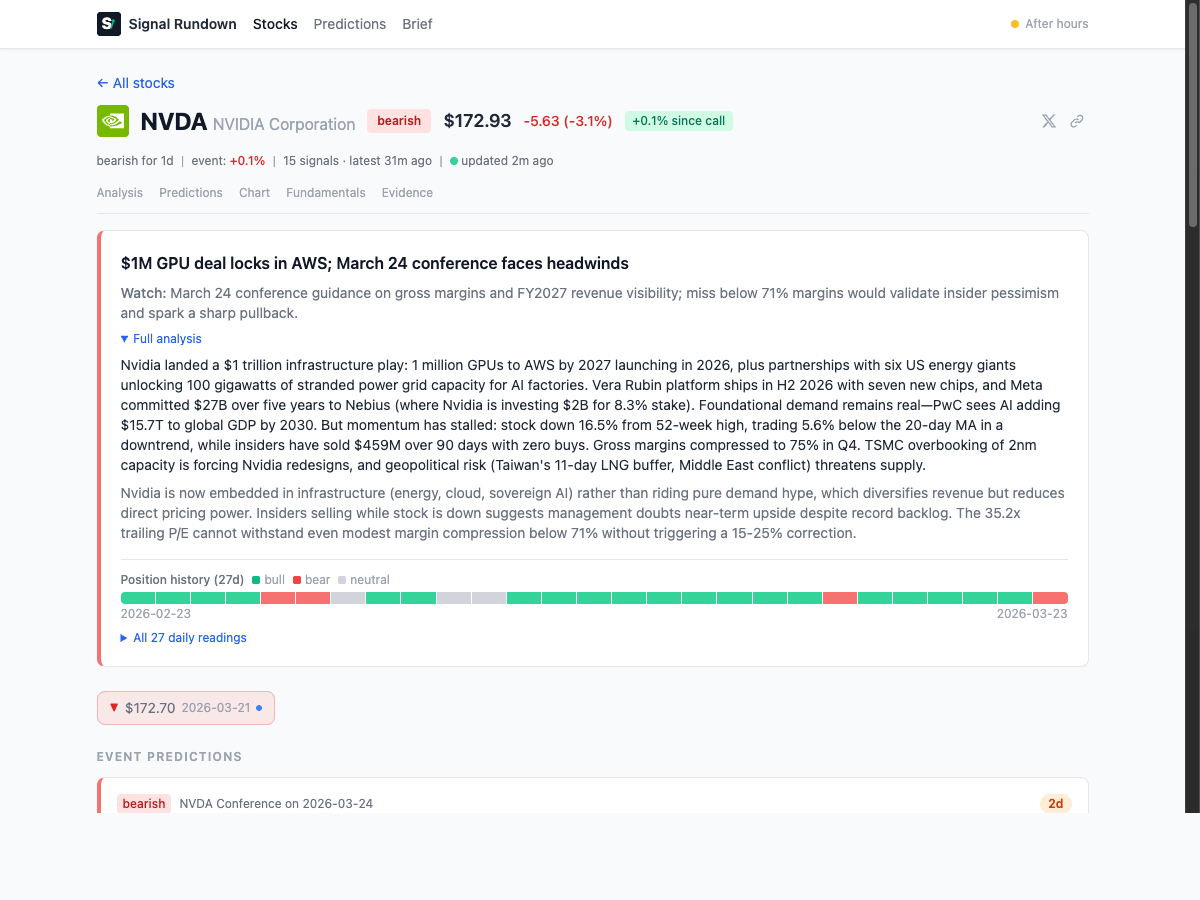
The system has been running in production for several weeks. Each entity page shows the AI’s full analytical state: direction, key data points, what to watch, insider activity, analyst consensus, and active predictions.
Here’s an example of the social card the system generates for NVDA:
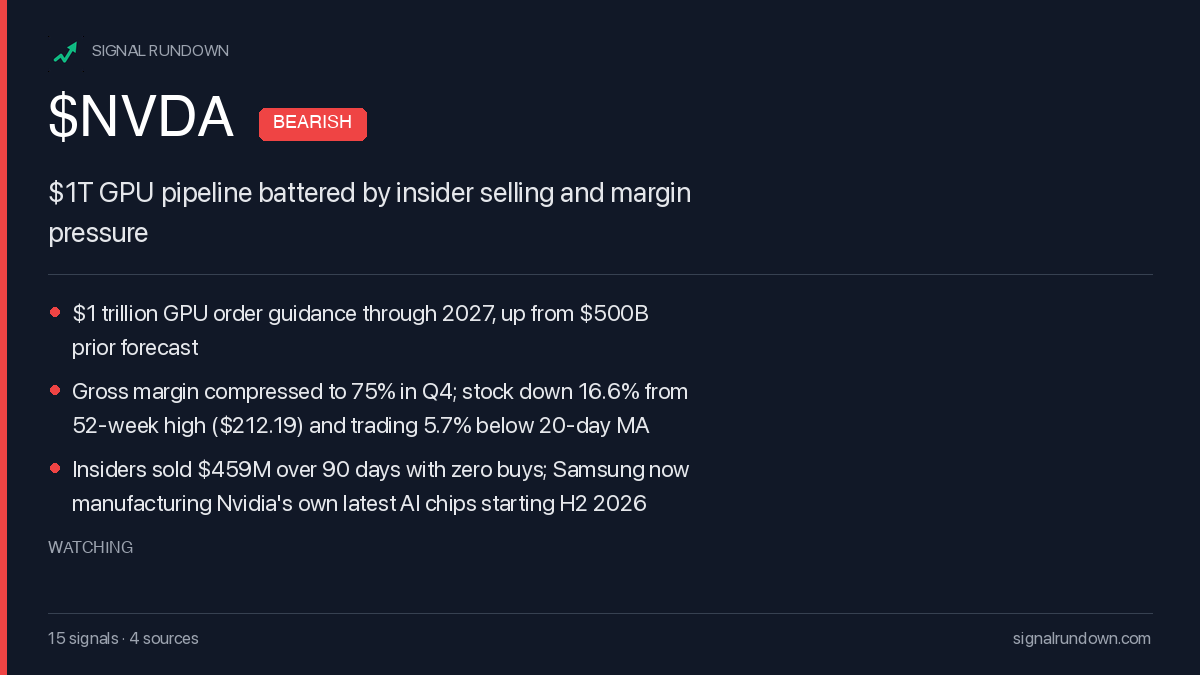
That’s not a summary of one article. That’s the synthesis of dozens of signals from multiple sources, updated every 2 hours. The system spotted the insider selling pattern, cross-referenced it with the margin data, and formed a view.
What’s Next
Two things I’m focused on:
Building the track record. The prediction system is live and scoring against real prices. As more events get scored, the accuracy data will speak for itself. I’ll publish results when there’s enough data to be meaningful.
Building in public. The dashboard is live at signalrundown.com. I’m posting the AI’s takes daily on @signalrundown on Twitter and Bluesky.
If you want to follow along, check out signalrundown.com.